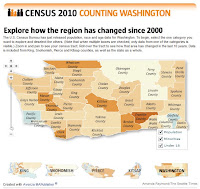
The Seattle Times has placed all of their census-related stories and features into a nice package for everyone to enjoy. With the release of population, race and age data by the U.S. Census Bureau, the Times has made an interactive map of Washington and four of its counties (King, Snohomish, Pierce and Kitsap).
By hovering over each section of the map, divided into counties and neighborhoods, you’ll be able to see how the number of people, minorities and minors has changed in the last decade.
Although this information is still extremely basic, more information by the Census Bureau will soon give companies a better idea of how to modify their marketing and business practices to reach new market segments.
If you’re interested in looking at the census results just for fun, take a look at the interactive map on the Seattle Times CENSUS 2010 page!

Reasons Why Responsiveness Matters for eLearning Localization
How do you deliver content that resonates across diverse languages…
Read More →

